IT builds can be challenging to convey the overall level of effort. Thankfully through a simple calculator a team can consistently communicate their knowledge, dependencies, the overall complexity and expected time all in one number, the story point.
It can be tempting to equate these numbers to hours of work, but each is just an estimate and relative (to other to-dos) value. The value will vary person to person as not everyone has the same knowledge or technical experience. The Fibonacci Sequence is a common numbering method to allow for more thought and variability when making the estimate.
I’ve built a calculator in Google Sheets to help finding that number, and you lucky reader you can take it to your team or use on your own!
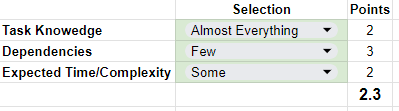
How to use:
Adjust the values B2-B4 based on the to-do in question. Once done, C5 will update with the estimated story points, round up/down as needed.
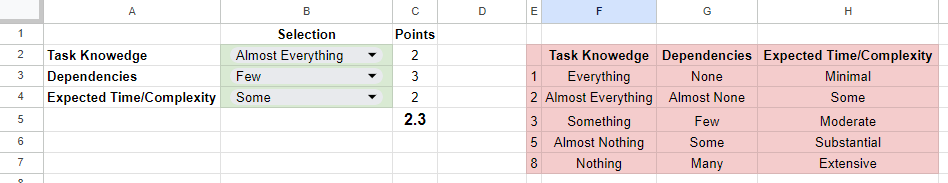
How it works:
The table in E2:H7 and assigns the E value for the row selected in the B column. The three values are then averaged in C5.
Formulas:
C2: =IFS(B2=F3,E3,B2=F4,E4,B2=F5,E5,B2=F6,E6,B2=F7,E7)
C3: =IFS(B3=G3,E3,B3=G4,E4,B3=G5,E5,B3=G6,E6,B3=G7,E7)
C4: =IFS(B4=H3,E3,B4=H4,E4,B4=H5,E5,B4=H6,E6,B4=H7,E7)
I acknowledge there may be some missing factors, the nice thing about Story Points is its all relative, make up your own terms and calculations! This iteration is what I’ve become comfortable with, add whatever represents your best estimate.

Leave a comment